
Guide to Renko Charts on cTrader
Up until just a few weeks ago, cTrader Renko Charts seemed like a far-fetched dream for a lot of cTrader users. The demand for this features has been huge. As far back as 2013 traders have been questioning Spotware’s intentions with regard to this feature.
In the meantime, many traders within the cTrader community have designed their own workaround. Using the cTrader Automate (previously known as cAlgo) platform traders took it upon themselves to solve this problem. Now they can take a breath of relief. cTrader Desktop supports Renko charts.
What are Renko Charts
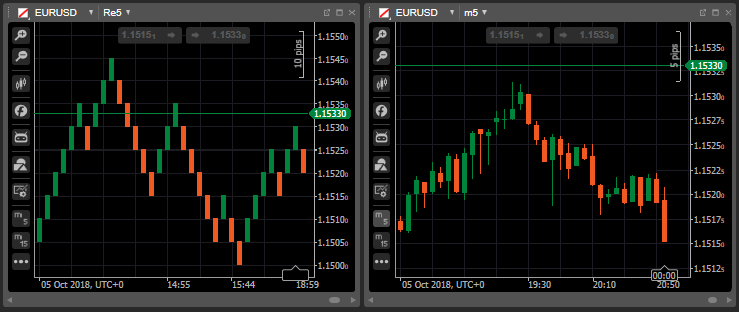
Renko Charts are not a typical chart type that you will ever see in the news, on Bloomberg or in your Google search results. Typically people focus on price movements over time. Whereas Renko Charts are based on price movements and not time periods. Renko charts look like bricks as opposed to candlesticks. This concept of price analysis is believed to have originated from Japan because in Japanese the work Renga means brick and it’s similar to Renko, the name of this chart type.
Why are Renko Charts Useful
Renko Charts can be applied to different markets, such as stocks and futures. But Renko Charts are especially useful in forex trading. This is because they are price based charts and the forex market is very volatile, meaning price movement can be significant, even in time periods lower than one minute. Traders find it beneficial to use Renko charts because they focus purely on price movement, which is at the end of the day, what we all hope to predict when trading and investing. Because of Renko Charts being based on price alone they can be very useful for establishing support and resistance levels and spotting breakouts.
How to Find Renko Charts in cTrader
In the cTrader Desktop, Renko Charts can be found by clicking the chart period drop-down menu. This menu has four columns with different chart types and intervals. You may need to scroll to find all of the intervals available for the chart types. Just choose the number of pips you want each period to represent and as you click your choice the chart will respond. Renko charts can also be added to your list of favourite chart periods.

How to use cTrader Renko Charts
Some traders find Renko Charts quite simple to use. If you glance at a cTrader Renko Chart you will notice a lot of consistency. The chart seems to zig zag in long strokes. Very often, when there is a change in direction, that can be a signal of a breakout, although it’s common for false signals to present themselves. If you understand the different actions, then you can easily incorporate reading this chart into your technical analysis routine. Obviously, no one chart or indicator can be depended on. But this chart can definitely add value when evaluating if you should follow through with a signal or not.
Support and Resistance Levels
Support and resistance is a common technical analysis technique that can be applied in a variety of ways. The two levels are plotted with horizontal lines. The resistance line is a threshold that the bull market is unable to push past. The support level is a barrier that holds the market and prevents it from falling. Renko Charts can be helpful in spotting these levels.

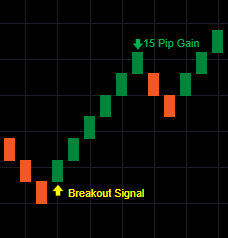
Breakouts
Renko Charts also help to spot a breakout from the support and resistance levels. When the market breaks out from its moment of calm (consolidation period) is the signal to open a position. The consolidation period is when the market is not moving in any particular direction and just fluctuating between the support and resistance levels.
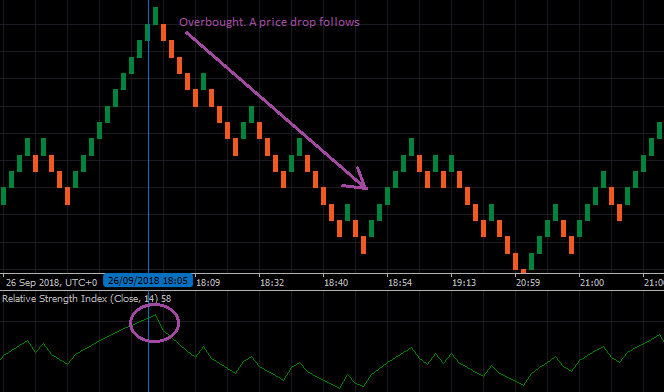
Overbought/Oversold
The concept of overbought and oversold is that of a trend nearing its expiration. As prices cannot move in one direction for eternity, they have to reverse at some point. Overbought and oversold is simply the transition period after the trend but before the reversal. Using cTrader Renko Charts can be helpful in spotting these levels and making a timely exit before the market starts to pull back.
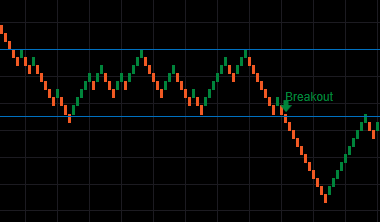
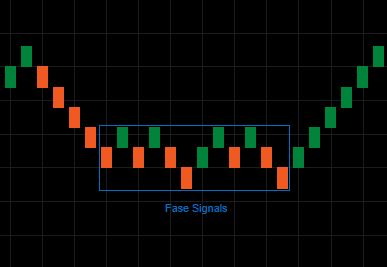
False Signals
A trading signal is a sign or indication to buy or sell based on technical analysis. A false signal is simply the technical analysis give a wrong indication even if the analysis was done correctly. When using the cTrader Renko Charts be aware they can often give false signals. This is when the bricks change colour too early, as seen below.
cTrader Renko Charts are a very effective tool to have in your technical analysis arsenal. Some traders proclaim them as the holy grail of forex trading. Unfortunately, there is no such thing. Why not try Renko Charts with Pepperstone, one of our prefered cTrader brokers. Read the Pepperstone review, or go open a demo account.

Comments are closed.