
Introduction to cTrader Ichimoku Indicator
If you are a regular forex and CFD trader then you must have come across the term cTrader Ichimoku Indicator. If you trade other instruments like Futures or Equities then you have probably seen this technical analysis indicator in other platforms. The Ichimoku Kinko Hyo indicator is commonly known as Ichimoku. In simple terms, it is essentially a technical indicator that sits on top of a chart. It’s used for gauging momentum in addition to future support as well as resistance areas. The Ichimoku cTrader indicator comprises of 5 distinct lines known as the kinjun-sen, tenkan-sen, senkou span A, chikou span and senkou span B. Here, learn more about the Ichimoku cTrader indicator, its pros & cons and how to use it for trading effectively.
Ichimoku Overview
The cTrader Ichimoku Indicator was created by a Japan-based newspaper writer called Goichi Hosoda in the year 1968. It is one of the most innovative and powerful indicators that is used by numerous traders around the globe. To determine how the indicator works, one must remember that Ichimoku is actually more of a strategy than a technical indicator. It essentially combines 2 support and resistance levels in order to develop a cloud or a reversal zone. For Ichimoku to provide trade alerts, the tenkan, as well as the kijun sen lines, must cross over.
How Does the Ichimoku Indicator Work?
- When the TenkanSen, as well as the KijunSen lines, are above Cloud, the trend is regarded to be positive.
- Alternatively, when the TenkanSen, as well as the KijunSen lines, are below Cloud, the trend is termed negative.
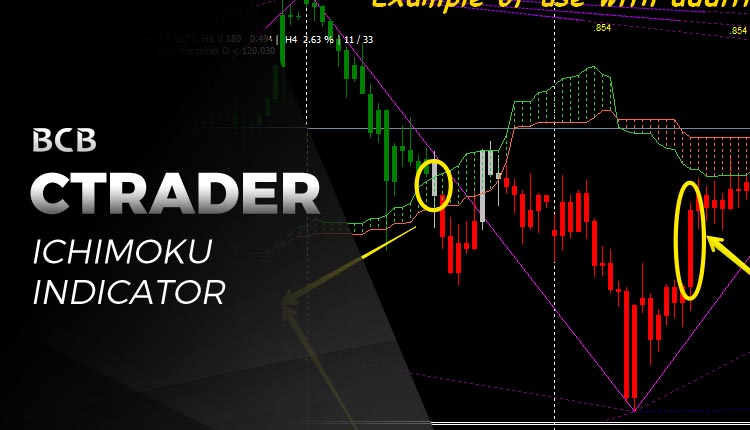
Traders can also use the cloud in order to assess the trend.
- Hence, when the prices go above Cloud, it indicates an uptrend and when the prices go below Cloud, it indicates a downtrend.
- When the Sendou A rises and goes above Senkou B, it means that there is a strengthening of the uptrend. On the flip side when the Senkou A falls and goes below the Senkou B, it indicates that there is a strengthening of the downtrend.
- A buying signal is indicated when Tenkan Sen goes above Kijun Sen whereas Kijun Sen, Tenkan Senas well as the price are above Cloud.
- A selling signal is indicated when TenKan Sen goes below Kijun Sen whereas Kijun Sen, Tenkan Sen, and the price are below Cloud.
Advantages and Disadvantages of Ichimoku
Before you use the indicator for trading forex or other financial instruments, it is important to understand that the indicator is an extremely complex trading tool that. The cTrader Ichimoku offers a great deal of information upon its depiction on a chart. The kumo, which is a cloud element of the technical indicator, comes handy during high volatility conditions. On the other hand, sticking only to one support & resistance levels on the trading chart may give rise to a number of false trading signals as well as minor failed trades.
However, if traders provide a zone, rather than a line, then this indicator can help in identifying more trusted signals as a result of the noise.
To sum up, one can say that the advantages of the Ichimoku Cloud indicator are automation, concision as well as simplicity. On the other hand, its disadvantages include the absence of customization. Also, the indicator shows blanket coverage of numerous possible market trends and configurations. If you feel that you can trade with 2 support/resistance levels, and 2 moving averages, then the indicator is definitely a good option.
Comments are closed.