
Moving Averages Explained
Moving Averages, commonly abbreviated to MA are a family of indicators which are essential to help determine the existence and strength of a trend. Moving Averages are based on previous prices which means the indicator lags and therefore cannot be used to predict prices. They are helpful to smooth out messy price data, such as spikes or similar anomalies. These anomalies can distort the results from other indicators.
Types of Moving Averages
In cTrader there are 6 types of moving averages that can be applied to charts. Simple, Exponential, Triangular, Time Series Triangular, Wilder Smoothing and Weighted. All of their formulas produce slightly different results and each type should be studied individually. The chart below shows six different types of Moving Average, all of them showing different results.
- Lime Green = Simple Moving Average (SMA)
- Grey = Exponential Moving Average (EMA_
- Sky Blue = Weighted Moving Average
- Yellow = Triangular Moving Average
- Purple = Time Series Moving Average
- Red = Welles Wilder Smoothing Moving Average


Simple Moving Average
Simple Moving Average or SMA is the simplest of all moving averages. It uses the values for each candlestick and divides by the number of periods. It smooths choppy markets less. SMA looks at all data equally which is why there are a lot of variations of this indicator where the focus is given to recent data or the middle range of data.

Exponential Moving Average
Exponential Moving Average or EMA is a commonly used type of MA and used often by professionals. It gives weight to the most recent periods, which decreases exponentially as you move into the past. Typically this would be used for short-term volatility and trading opportunities.
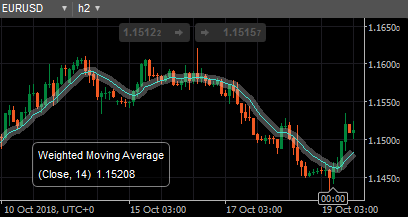
Weighted Moving Average
Weighted Moving Average, like EMA this type also applies weights to the values, but the weights increase by 1 and not exponentially, therefore, the emphasis is given to recent periods.

Triangular Moving Average
Triangular Moving Average has a weighting scheme that emphasizes the middle range of data. This MA is calculated twice, therefore, it’s double smoothed, this is very helpful in volatile markets and can be useful to pair with other MA types that focus on recent data (such as Exponential Moving Average).

Time Series Moving Average
Time Series Moving Average is calculated using linear regression techniques on the closing prices as opposed to just using the raw closing price. It’s more of a statistical technique than using just the averages of previous prices.
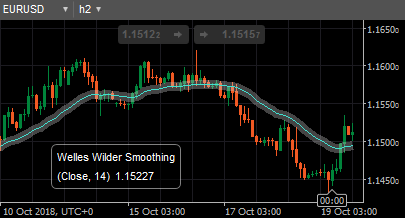
Welles Wilder Smoothing Moving Average
Welles Wilder Smoothing Moving Average is actually very similar to EMA with a minor tweak in the formula so that it will respond slower to price changes, but still faster than SMA. Welles Wilder is a famous technical analyst and has developed several indicators that are commonly used by traders every day, this is just one of them.
Additionally, the VIDYA Moving Average is available to use as the MA type in certain indicators such as Bollinger Bands. This type dynamically adjusts based on market volatility and makes it more useful for assessing the current market conditions.
How do Moving Averages Work
When drawing a moving average you need to input two parameters. These are the Source and Periods. Source determines the type of Trendbar data will be used for the calculation of the average (Open, Close, High or Low). Periods determines how many Trendbars will be used for the calculations according to the currently applied timeframe.
In cTrader the default for all types of moving averages is to use Close prices and 14 Periods. When applying the indicator you can customize your settings. 14 Periods are considered low and would be considered for short-term use, whereas larger periods would be used for spotting mid-term or long-term trends. Then when you apply the indicator, the moving average will be plotted on the chart with the specific formula for the MA type you are using and the settings you chose.
For example, drawing a 14-period moving average based on Close prices in the 5-minute time frame will add all of the close prices of the latest 14 candlesticks of the 5-minute timeframe and divide them by 14. The result will be plotted in the chart for each candlestick. The line will automatically connect all those points forming the moving average indicator.
Interpreting Moving Averages
When reading Moving Averages, if the price is above the average, that’s considered to be an uptrend, if the price is below the average the market is considered to be in a downtrend. This chart shows a scenario of reading a Moving Average.
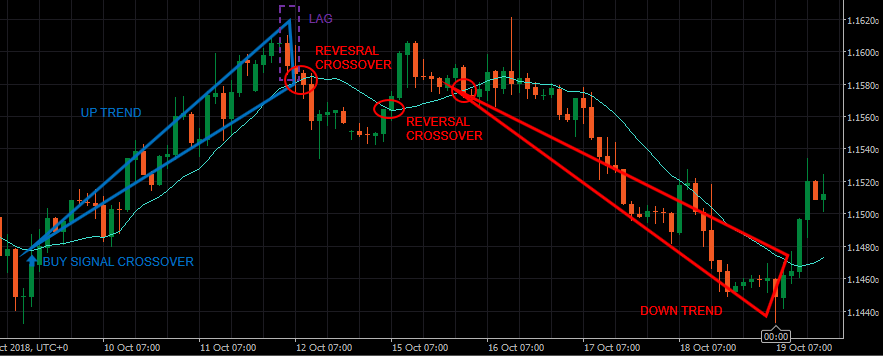
Moving Averages can be helpful because:
- They look at crossovers as signals to enter a trade, speculating that the price will continue going in the direction of the crossover
- They look at the distance between moving averages to determine the strength of the trend
- They look for retracements to the moving average during a trend
- They look for scrambled moving average to avoid trend trading and try range or breakout

Comments are closed.