

What are Bollinger Bands
Bollinger Bands are a type of indicator used in technical analysis to gauge the volatility of a market. Their use is quite common amongst traders. They are considered a basic part of most traders toolkit and are a default indicator available in most trading platforms. cTrader is no different, the Bollinger Bands indicator is ready to use out of the box. It’s available on Desktop, Web and Mobile versions of cTrader.
What are Bollinger Bands for?
While the interpretation of any technical analysis indicator varies the most typical uses of Bollinger Bands are for finding;
- Overbought/oversold: They can be used as an overbought/oversold indicator to indicate buying at a lower band and selling at the higher band during range periods. Or buy or sell at the moving average with the direction of the trend and exiting at the upper or lower band according to the direction of the position.
- Breakouts: They are great for spotting breakouts when there is sharp movement after the bands have contracted (squeezed) for a long period of time.
- Reversals: They can be used to find good spots to take profits or major reversals when the price deviates extremely from the moving average.
Bollinger Bands in cTrader
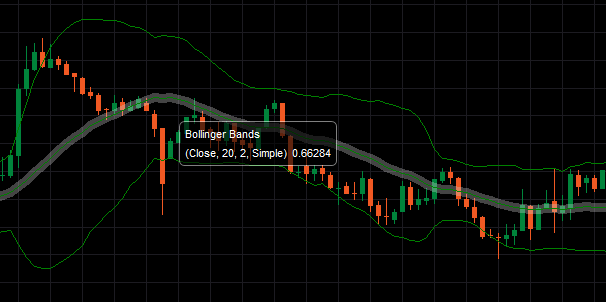
In cTrader the Bollinger Bands indicator is plotted on top of the price chart. It works by drawing a moving average line on the chart and then adding and subtracting standard deviations to that moving average. Standard deviations are used to measure the volatility. This forms a channel that will theoretically contain the biggest percentage of the price movement according to statistical theories of standard deviation and normal distribution. The distance between the upper and lower Bollinger Band shows the volatility of the market. The further apart the bands are the more volatile the market.
The parameters of the indicator are Source, Periods, Standard Deviations and Ma type. Source defines if open high close or low is used. Periods define the periods of the moving average of the bands. Standard deviations define the amount of standard deviation to be added and subtracted from the bands. Ma Type defines the type of moving average.
The Moving Average Types that can be used for Bollinger Bands in cTrader are Simple, Exponential, Time Series, Triangular, VIDYA Weighted and Wilder Smoothing.

Conclusion
Bollinger bands can compliment Renko Charts very well as both indicators help to spot similar events. This means one indicator or signal can verify another. As Bollinger Bands incorporate a Moving Average you should be careful which indicators you pair them with. Average True Range, MACD Crossover and Stochastic Oscillator are popular examples of such indicators in cTrader that also use Moving Averages.
Origin Story
This explanation would not be complete without including the origin story of Bollinger Bands. This indicator was created by a gentleman named John Bollinger. Presumably no relation to the champagne. John Bollinger has developed a trading system to accompany his indicator and is explained in his book Bollinger on Bollinger Bands.

Comments are closed.